

- Joined
- Dec 30, 2024
- Messages
- 396
- Reaction score
- 208
- Points
- 62
- Website
- blackhatpakistan.net
- Points
- 1,108
- USD
- 1,108
A Wireshark tutorial starts with three moves: install the analyzer, capture packets on the right interface, then filter the noise down to the traffic you actually care about. Wireshark is a free, open-source network protocol analyzer that records live packets and decodes over two thousand protocols - TCP handshakes, HTTP headers, DNS queries, TLS negotiations - so you can see exactly what crossed the wire instead of guessing from logs. This tutorial follows that path end to end: your first capture, the display filter syntax that makes Wireshark powerful, follow-TCP-stream reconstruction, and the statistics views that summarize an entire capture in one screen.
TL;DR - Download Wireshark from wireshark.org, install with Npcap (Windows), open Capture Interfaces, pick your NIC, keep promiscuous mode ON, and start. Learn display filters first: ip.addr==10.0.0.5, tcp.port==443, http.request.method=="GET". Use Follow -> TCP Stream to read whole conversations, Statistics -> Protocol Hierarchy to profile the capture, and remember - capture filters run at record time (BPF syntax), display filters run at read time (Wireshark syntax).
STEP 1 - INSTALL
STEP 2 - YOUR FIRST CAPTURE
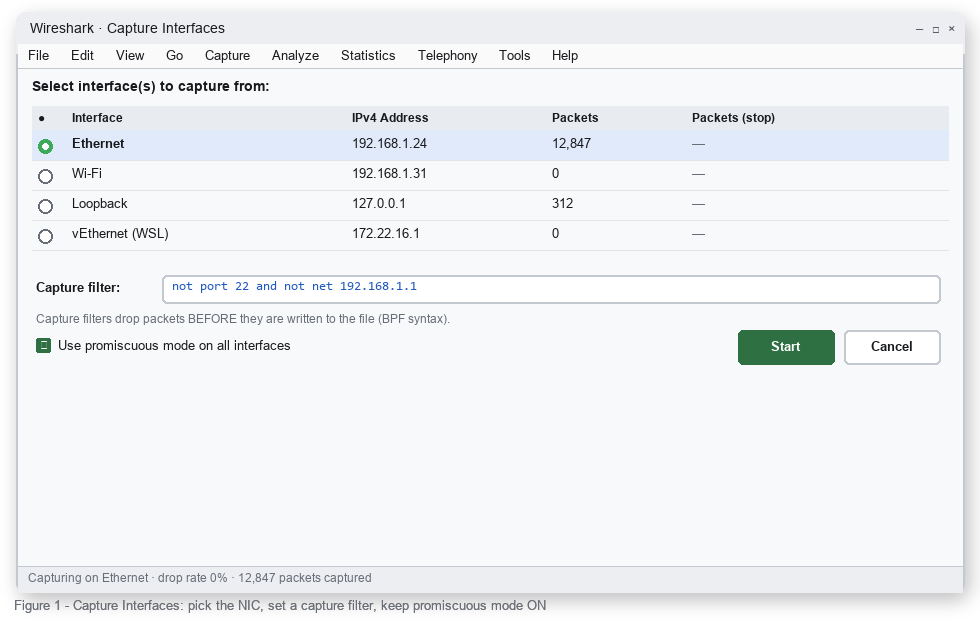
Open Capture -> Options (or Ctrl+K). The dialog shows every interface with its live packet count - the counter that moves while you browse is your capture target.
STEP 3 - READ THE PACKET LIST
The main window is four panes: the packet list on top (one line per packet), packet details (decoded layers), packet bytes (raw hex), and the status bar.
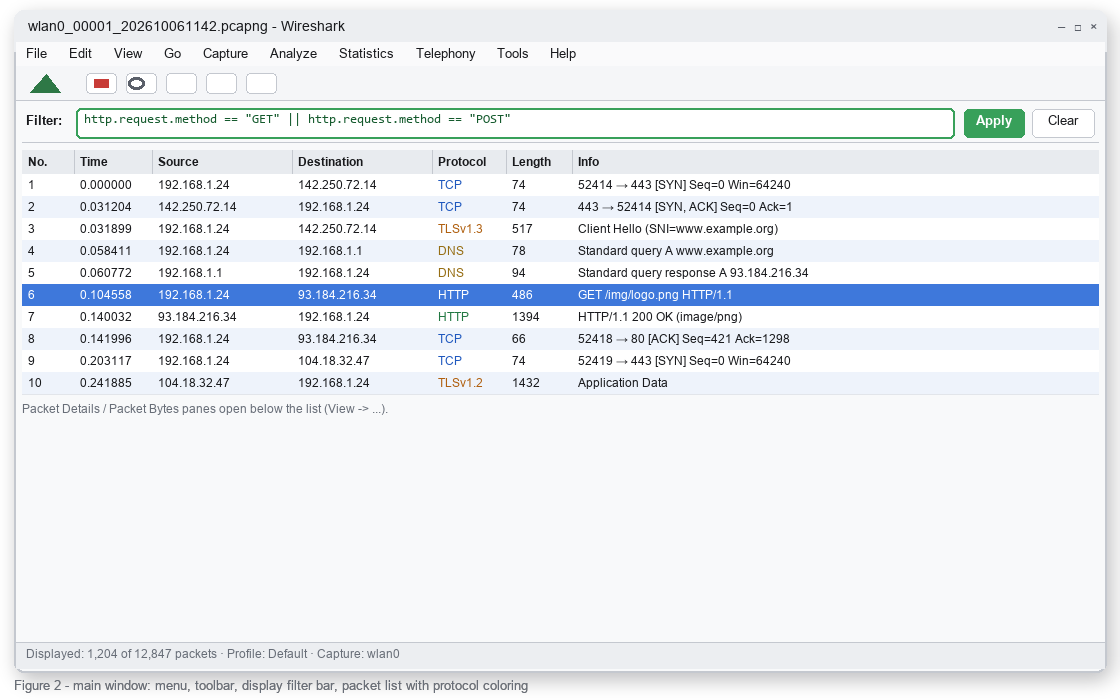
Columns matter more than they look. No. is the frame number, Time is seconds since capture start, Source/Destination are the endpoints, Protocol is the decoded type, and Info is the decoder's one-line summary - for TCP that includes flags, sequence numbers, and window size, which is where half of troubleshooting happens. Protocol coloring is built in: TCP renders blue, HTTP green, DNS yellow, TLS orange. Custom rules live under View -> Coloring Rules.
STEP 4 - DISPLAY FILTERS (THE ACTUAL SKILL)
The filter bar is where Wireshark earns its reputation. Type an expression, hit Apply - everything not matching disappears from the list (the packets stay in the file; only the view changes). Invalid syntax turns the bar red, which is Wireshark telling you the parser rejected the expression, not that capture failed.
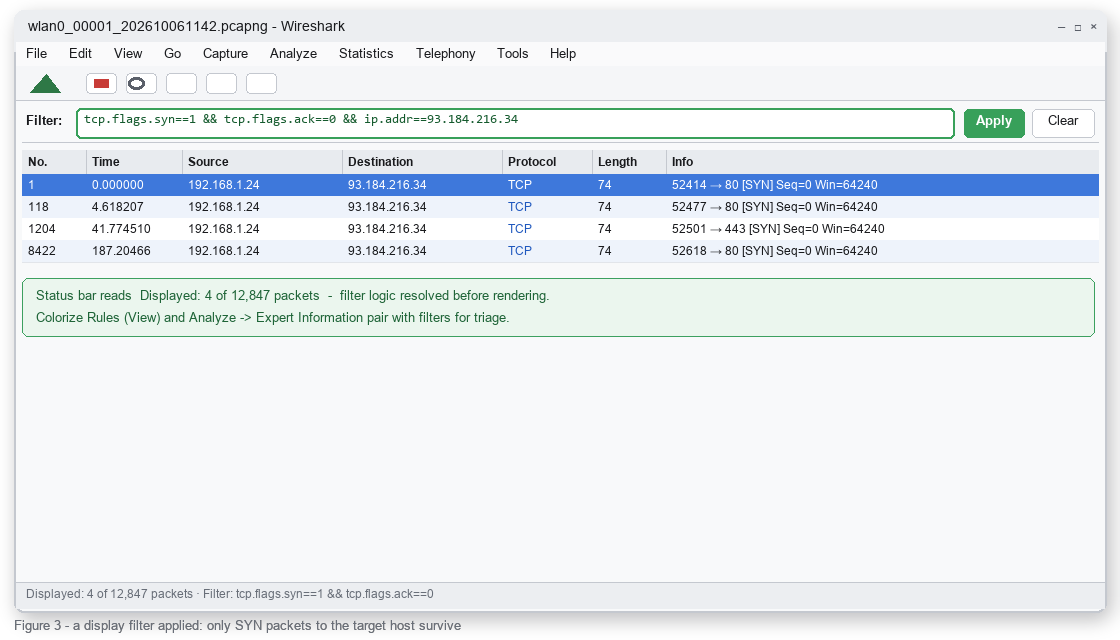
Ten filters worth memorizing:
Chaining is where it gets sharp: tcp.port==443 && ip.addr==203.0.113.7 filters to one host on one port, and typing a field name alone (ip.addr) autocompletes the operators that are legal for it - field type errors are the number one beginner filter mistake.
STEP 5 - FOLLOW THE CONVERSATION
A packet list shows moments; Follow -> TCP Stream (right-click any packet in the flow) reassembles the whole byte stream between the two endpoints, ordered and de-duplicated.
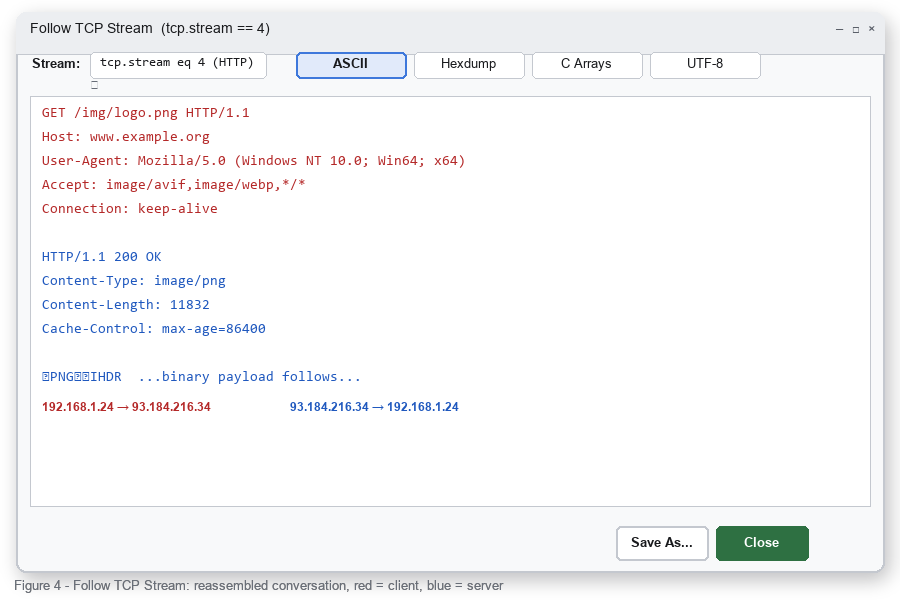
Red lines are the client side, blue lines the server side - an HTTP request/response pair reads top to bottom exactly as the application saw it. This is how you pull credentials from unencrypted logins, reconstruct file downloads (Follow HTTP Stream shows the same view for HTTP), and confirm whether a client retried or the server refused. The conversation opens as tcp.stream == N - that index is stable for the whole capture, so you can filter tcp.stream==4 in the main window to isolate everything else belonging to that flow.
STEP 6 - STATISTICS VIEWS
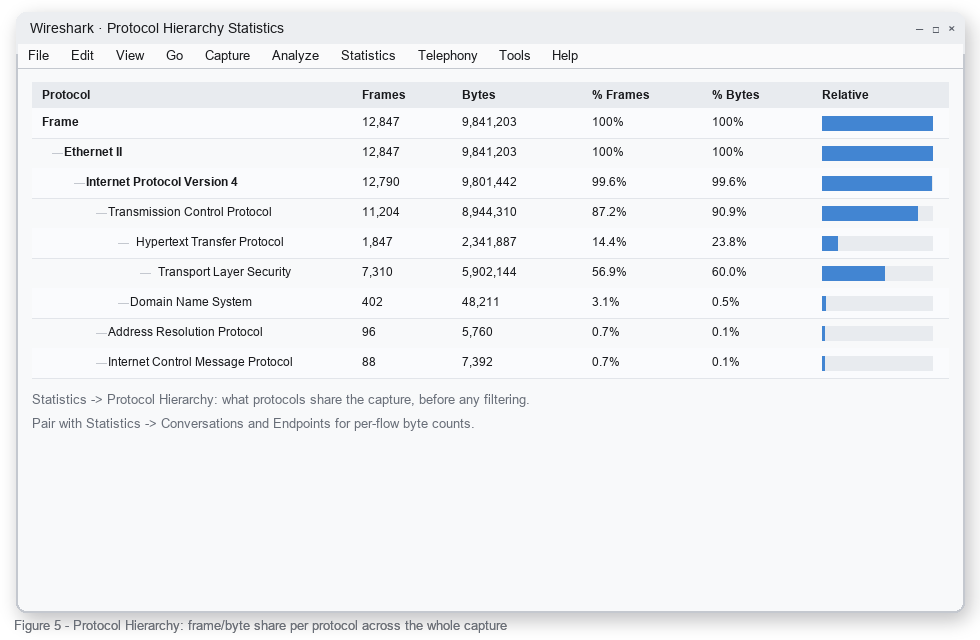
Before reading packets one by one, profile the capture - Statistics -> Protocol Hierarchy answers "what is in here" in one screen.
CAPTURE FILTER VS DISPLAY FILTER
COMMON MISTAKES
FAQ
Q: Is Wireshark legal?
A: Analyzing packets you are authorized to see - your own systems, your lab, a client engagement with written scope - is normal engineering practice. Capturing traffic you are not party to on networks you do not own is a different matter entirely; the tool does not know which situation you are in, the law does.
Q: What is the difference between a capture filter and a display filter?
A: Capture filters decide what gets recorded (BPF, set once at start). Display filters decide what gets shown (Wireshark syntax, change freely). Capture-time mistakes delete data; display-time mistakes cost one Ctrl+Z.
Q: Why does Wireshark show only TCP and TLS - where is my HTTP?
A: Modern sites are HTTPS, so application data sits inside TLS records. You will still see the handshake, SNI in Client Hello, and certificates - plaintext HTTP only appears for genuinely unencrypted endpoints.
Q: Can Wireshark decrypt TLS?
A: Only when it has the keys - session keys exported by the client (SSLKEYLOGFILE environment variable) or RSA keys from a lab endpoint you control. On live traffic from hosts you do not control, no.
RELATED ON BLACKHAT PAKISTAN
Nmap Cheat Sheet - 40 scan commands to pair with the traffic you capture.
Burp Suite Tutorial - the web-layer view of the same requests.
Metasploit Tutorial - knowing what an exploit session looks like on the wire.
DDoS Attack Basics - traffic floods are a statistics-view problem first.
TL;DR - Download Wireshark from wireshark.org, install with Npcap (Windows), open Capture Interfaces, pick your NIC, keep promiscuous mode ON, and start. Learn display filters first: ip.addr==10.0.0.5, tcp.port==443, http.request.method=="GET". Use Follow -> TCP Stream to read whole conversations, Statistics -> Protocol Hierarchy to profile the capture, and remember - capture filters run at record time (BPF syntax), display filters run at read time (Wireshark syntax).
STEP 1 - INSTALL
- Grab the stable build from wireshark.org - Windows users get the installer plus Npcap (the packet capture driver; check "Install Npcap in WinPcap API-compatible mode" if you run older tools alongside).
- Linux: sudo apt install wireshark, then add your user to the wireshark group (capture without root).
- macOS: Wireshark ships with its own ChmodBPF helper - same idea, capture permission granted at install.
- Launch it once after install and confirm the interface list populates - if it is empty, the capture driver did not land.
STEP 2 - YOUR FIRST CAPTURE
Open Capture -> Options (or Ctrl+K). The dialog shows every interface with its live packet count - the counter that moves while you browse is your capture target.
- Select the interface carrying your traffic (Ethernet at home, Wi-Fi on laptops, any vEthernet for lab VMs).
- Keep Use promiscuous mode on all interfaces checked - without it you only see traffic addressed to your host, not the segment.
- Optional capture filter example: not port 22 keeps your own SSH session out of the file. Capture filters are BPF syntax and they run BEFORE packets are written - think of them as the recording boundary.
- Start the capture, generate a little traffic (load a page, hit an API), stop with the red square. A few seconds is enough to work with.
STEP 3 - READ THE PACKET LIST
The main window is four panes: the packet list on top (one line per packet), packet details (decoded layers), packet bytes (raw hex), and the status bar.
Columns matter more than they look. No. is the frame number, Time is seconds since capture start, Source/Destination are the endpoints, Protocol is the decoded type, and Info is the decoder's one-line summary - for TCP that includes flags, sequence numbers, and window size, which is where half of troubleshooting happens. Protocol coloring is built in: TCP renders blue, HTTP green, DNS yellow, TLS orange. Custom rules live under View -> Coloring Rules.
STEP 4 - DISPLAY FILTERS (THE ACTUAL SKILL)
The filter bar is where Wireshark earns its reputation. Type an expression, hit Apply - everything not matching disappears from the list (the packets stay in the file; only the view changes). Invalid syntax turns the bar red, which is Wireshark telling you the parser rejected the expression, not that capture failed.
Ten filters worth memorizing:
Code:
ip.addr==10.0.0.5                 traffic to or from one host
ip.src==192.168.1.24 && ip.dst==10.0.0.5    one conversation, both ends named
tcp.port==443                        anything on HTTPS, client or server side
tcp.port==80 || udp.port==53          web plus DNS in one view
tcp.flags.syn==1 && tcp.flags.ack==0  connection attempts only (SYN scan hunting)
http.request.method=="GET"           HTTP GETs
dns.qry.name contains "analytics"    lookups for a domain pattern
tls.handshake.type==1                TLS Client Hello messages
frame contains 4d:5a                 packets carrying an MZ header (PE file bytes)
!(arp)                               everything except ARP noise
Chaining is where it gets sharp: tcp.port==443 && ip.addr==203.0.113.7 filters to one host on one port, and typing a field name alone (ip.addr) autocompletes the operators that are legal for it - field type errors are the number one beginner filter mistake.
STEP 5 - FOLLOW THE CONVERSATION
A packet list shows moments; Follow -> TCP Stream (right-click any packet in the flow) reassembles the whole byte stream between the two endpoints, ordered and de-duplicated.
Red lines are the client side, blue lines the server side - an HTTP request/response pair reads top to bottom exactly as the application saw it. This is how you pull credentials from unencrypted logins, reconstruct file downloads (Follow HTTP Stream shows the same view for HTTP), and confirm whether a client retried or the server refused. The conversation opens as tcp.stream == N - that index is stable for the whole capture, so you can filter tcp.stream==4 in the main window to isolate everything else belonging to that flow.
STEP 6 - STATISTICS VIEWS
Before reading packets one by one, profile the capture - Statistics -> Protocol Hierarchy answers "what is in here" in one screen.
- Protocol Hierarchy - frame and byte share per protocol; TLS dominating tells you the capture is mostly encrypted web traffic before you look at a single packet.
- Conversations - per-flow packet and byte counts, sortable; the biggest TCP conversation is often the problem you came to find.
- Endpoints - same data grouped by host instead of flow.
- I/O Graph - traffic rate over time; spikes line up with user-reported "the network died around 14:32" moments.
CAPTURE FILTER VS DISPLAY FILTER
- Capture filter - BPF syntax (host 10.0.0.5, port 443, not arp), set BEFORE capture starts, cannot be changed afterward. Missing packets stay missing.
- Display filter - Wireshark syntax (ip.addr==10.0.0.5, tcp.port==443, !arp), applied any time to loaded files. Nothing is lost; you are just looking through a narrower window.
- Default practice: capture everything (or nearly), filter at read time - you keep the option of asking questions you did not know you had.
COMMON MISTAKES
Code:
Red filter bar       syntax error - field/operator mismatch, not a capture problem
0 packets             wrong interface, or capture filter too strict
Only my own traffic   promiscuous mode off, or switched network needs a SPAN port
Huge files           unfiltered capture on a busy link - use a capture filter or ring buffer
Reads look empty      traffic is TLS - filter tls or read handshake metadata instead
FAQ
Q: Is Wireshark legal?
A: Analyzing packets you are authorized to see - your own systems, your lab, a client engagement with written scope - is normal engineering practice. Capturing traffic you are not party to on networks you do not own is a different matter entirely; the tool does not know which situation you are in, the law does.
Q: What is the difference between a capture filter and a display filter?
A: Capture filters decide what gets recorded (BPF, set once at start). Display filters decide what gets shown (Wireshark syntax, change freely). Capture-time mistakes delete data; display-time mistakes cost one Ctrl+Z.
Q: Why does Wireshark show only TCP and TLS - where is my HTTP?
A: Modern sites are HTTPS, so application data sits inside TLS records. You will still see the handshake, SNI in Client Hello, and certificates - plaintext HTTP only appears for genuinely unencrypted endpoints.
Q: Can Wireshark decrypt TLS?
A: Only when it has the keys - session keys exported by the client (SSLKEYLOGFILE environment variable) or RSA keys from a lab endpoint you control. On live traffic from hosts you do not control, no.
RELATED ON BLACKHAT PAKISTAN
Nmap Cheat Sheet - 40 scan commands to pair with the traffic you capture.
Burp Suite Tutorial - the web-layer view of the same requests.
Metasploit Tutorial - knowing what an exploit session looks like on the wire.
DDoS Attack Basics - traffic floods are a statistics-view problem first.


